My Adventures in Data Science – A Recap

Since starting my General Assembly Data Science course, I’d gotten swept away with a million different things – working on my project, tentatively picking up a writing project I’ve had on hold FOREVER (more info on that coming soon), being asked to be a part-time Teaching Assistant for similar data bootcamp, of which I promptly had to leave for an exciting new full time job in data science, and then prepping to moving to a new apartment – that I just couldn’t keep the promise of a weekly update for the goings-on of my class.

As I’m writing this, while I should be putting some finishing touches on my final paper for my course, I wanted to do a quick recap of the last several weeks of my class.

Continue reading “My Adventures in Data Science – A Recap”

My Adventures in Data Science – Week 4

Week 4 was the first week back after winter break, so it was a bit hard to get back into the swing of things, even though I had been diligently (mostly) working on my project.

On Monday, we were introduced to Logistic Regression, or ‘hipster regression’ as our instructor put it.  Not exactly sure why it’s called that…

Anyway, logistic regression is a method of machine learning that’s basically used everywhere.  From fraud detection to medical diagnoses to customer churn.  I was already familiar with the method before the lesson, and it’s one that I plan to implement for my current project, but I was learning it formally for the first time.  Discovering the math behind logistic regression was incredibly helpful in understanding its pros and cons in prediction.

An illustration of the logistic function from class

On Wednesday we discussed another method called Naive Bayes Classification.  Completely new material to me and I’m honestly still daunted by the math and all the definitions for “prior probability”, “posterior probability”, and why it’s even called Naive in the first place (because it assumes independence of features, which may not be true.)

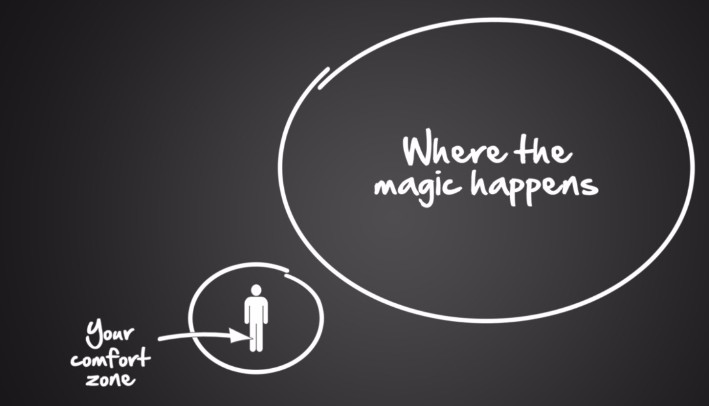
The instructor seemed to sense that many of us were stumped and reminded us that it’s okay!

Inspirational slide from class :)
Inspirational slide from class 🙂

 Well, I’m definitely outside of my comfort zone now.  Homework this week was challenging, but I’m excited about what I’ve learned and how I could apply it.  I just hope I’m doing it correctly… time to go to office hours.

My Adventures in Data Science – Week 3

Week 3 was jam-packed with material as we prepared for the two week holiday break.

On Monday we did a quick exercise with Pandas which I found extremely useful.  I’ve gotten too accustomed to working with R, so Pandas’ dataframes and Python’s superior efficiency are a joy to work with.  I’ll definitely be using it more for my future data projects, particularly the upcoming one for this course.

We also talked about model evaluation on Monday: how to avoid overfitting a model to old data so that predictions for new data are accurate.

That fit well with Wednesday’s discussion of bias and variance, for which I have this lovely illustration to do the explaining of both for me.

Screenshot 2015-12-23 23.00.44

We then talked about using regularization to balance the bias-variance tradeoffs.  I’m still wrapping my head around it, so thankfully I have a couple weeks to carefully review.

I’m also hoping to spend the next weeks off gathering and cleaning data for my aforementioned final project!

What’s my project about? Well, I did mention in my Week 1 post about building off the work I’ve done for the Simple Word Count Tracker and my NaNoWriMo research efforts.  I hope to build an analytical model that can predict whether or not a writer will win the NaNoWriMo challenge of writing 50,000 words in November.

My biggest first obstacle is acquiring the rest of the data I will need.  I have a lot of word count data, obviously, but just for the most recent NaNoWriMo.  I also want to acquire data besides word counts, such as whether a user was a donor to NaNoWriMo, who and what are their favorite authors and books, the year they joined NaNoWriMo, where they are located, and any other variable that might be an indicator of their likeliness of “winning”.  I’ve realized the best way to get this data that isn’t just emailing the website organizers and asking for it (believe me, I tried) is to write a script to scrape the html of user profiles on the website.

Thankfully my instructor and TA have pointed me in the direction of a lot of good resources for me to start this.  Bring it on.

Here’s to a fun and productive break!

My Adventures in Data Science – Week 2

The pace of week 1 felt slow for me; week 2 went a bit faster.

Monday involved a quick overview of Python syntax.  I’ve used Python before, but not extensively, so I found the in-class exercise a bit challenging.  Thankfully, a quick review before the next class prepared me for the tougher exercise on Wednesday. Yay studying! It works, kids!

c40e0dadaea097739730da5636f48c29

Wednesday’s exercise was on the K-Nearest Neighbors Algorithm.  I talk more about this in more technical detail on my data blog.  It was a fun first glance into the world of Machine Learning Algorithms.  Can’t wait to learn more complex predictive analytics as the class continues!


My Adventures in Data Science – Week 1

You may have gotten a hint of it from reading a few of my posts here, but if you follow me elsewhere say, on this blog, you’ll know that I’m passionate about data science.  I decided to enroll in General Assembly’s Data Science part time, semiweekly course.  11 weeks of programming, statistics, and sifting through data.  If you’re a geek like me, that translates to approximately 11 weeks of fun!

The class is set up to focus on developing ‘Type A’ data scientists (analyst leaning) rather than ‘Type B’ data scientists (programmer leaning), which I am a little disappointed about.  While I do need a strong refresher in my statistics, I definitely wanted to ramp up my coding abilities more.  Still, I’m hoping to get a lot from this course, especially in regards to learning complex machine learning algorithms and better Python programming practices.  Above all, it will serve as a good stepping stone for finding a new role in data science, or for preparing myself for further studies in data science.

The first week so far has just been introductions.  My classmates are so diverse in personal, professional, and academic backgrounds.  I’m certain I’m one of the youngest in the class, if not the youngest.  Some have had a lot of experience working with data as analysts with no programming background, and others have done a ton of coding, but lack a strong statistics foundation.  I feel like I’m somewhere in the middle, but we’ll see.

In the Monday class, after introductions and orientation, we learned some command line basics.  Easy stuff for me, as I’d been using it extensively in school and in work, but I recognize it’s very new and cryptic to others.  I finished my exercises early and helped the people sitting next to me with theirs.  (I felt really cool about that.)

On Wednesday, some alums from the previous class visited to present their class projects.  One student created a model to predict GDP from data collected from the CIA website.  Another built a recommendation system for meal recipes based on inputted ingredients.  I felt both excited and scared about my own project.  The instructor told us to expect putting in 200 to 300 hours of work! Still, I’m stoked that in just a few weeks I’ll know enough to start putting together insightful analyses and predictive models of my own.  Can’t wait! I hope I can use the data I collected from the Simple Word Count Tracker I created for NaNoWriMo.  I think it would be awesome to be able to use data to predict if someone could win NaNoWriMo before NaNoWriMo even began.  More on that as class goes on, I guess.

Wednesday was also supposed to be the day we go over some Python basics, however, we got a little behind during the lesson on Git.  I’m familiar with both Python and Git, so that lesson felt pretty slow for me even though it was good review.  Hopefully things will pick up in next class.  Looking forward to it.

In the meantime, here’s a quick visualization (created in Tableau) of something I learned this week about the Data Science Workflow:

Screenshot 2015-12-07 11.35.52